Key Takeaways
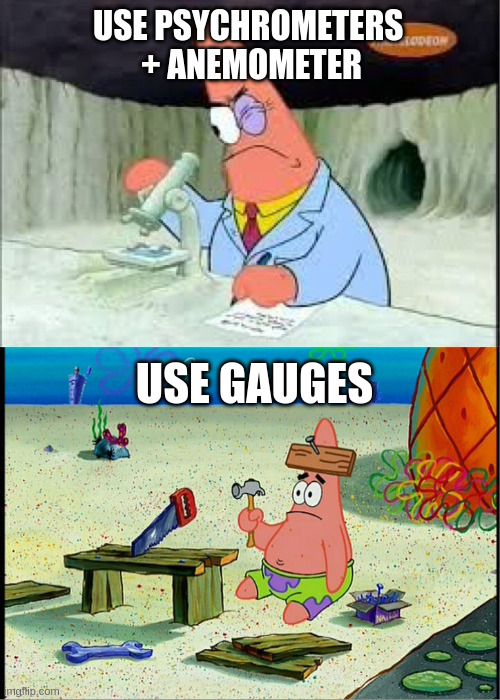
- Psychrometric capacity measurement replaces the need to connect gauges on every call: Using two psychrometers and a hot wire anemometer, calculate actual system output directly from airside data without touching refrigerant lines.
- Measured CFM beats assumed CFM every time: A 2-ton nameplate system might move 200 CFM less than expected due to dirty filters, duct leaks, or fan degradation. That changes your capacity calculation by 10 to 20 percent.
- The physics is simple enough to teach in 15 minutes: Sensible capacity and total capacity follow two basic formulas with simple derivations.
- Capacity shortfalls create ethical selling moments: When measured output is 1.5 tons on a 2-ton nameplate, you have data-backed justification for commissioning work, coil cleaning, or replacement.
Why Airside Measurement Matters More Than Gauges
Most technicians learned to grab gauges first: pull the gauges, check superheat and subcooling, diagnose. But that reflex catches only half the picture.
Gauges tell you what the refrigerant is doing. Airside measurement tells you what the customer is getting. A system can have perfect superheat and subcooling on the gauges and still deliver 30 percent less cooling capacity than the customer paid for. That happens when the evaporator is loaded with dust, the blower wheel is underspeeding, or the ductwork is leaking. The gauges won’t catch it. The airside numbers will.
The real power: you can walk into a service call with just three instruments (two psychrometers and a hot wire anemometer) and tell the customer exactly how much BTU their system is moving. No refrigerant connections. No hazmat concerns. Just physics.
The Psychrometric Formulas You Need to Know
Every capacity measurement starts with return air (temperature and humidity) and supply air (temperature and humidity).
Sensible Capacity measures temperature change only.
Qs = 1.08 × CFM × (T_return – T_supply)
The 1.08 constant comes from physics: air weighs about 0.075 pounds per cubic foot. It takes 0.24 BTU to raise one pound of air by one degree Fahrenheit. There are 60 minutes in an hour. Multiply: 0.075 × 0.24 × 60 = 1.08.¹
Critical caveat: These constants assume standard sea-level conditions at 29.92 inches of mercury. At altitude, air density drops. In Denver at 5,280 feet, the density falls to roughly 0.062 lb/ft³, making the constant approximately 0.90, not 1.08. Using 1.08 in a mile-high city reads about 17 percent low. Know your elevation.
Total Capacity includes sensible cooling and latent cooling (moisture removal).
Qt = 4.5 × CFM × (h_return – h_supply)
Here, h is enthalpy (total heat content in BTU per pound of air). The 4.5 constant comes from 0.075 lb/ft³ × 60 min/hr. The enthalpy difference captures both temperature drop and humidity drop.
Example: 400 CFM measured, return at 80 degrees, supply at 60 degrees (20 degree drop).
Qs = 1.08 × 400 × 20 = 8,640 BTU/hr sensible, or 0.72 tons.
That’s nowhere near 1 ton nameplate because a typical 1-ton system runs 60 percent sensible and 40 percent latent. The remaining capacity is drying the air. A healthy 1-ton system at 400 CFM approaches 12,000 BTU total when measured with enthalpy. If it measures 9,000 BTU, something is restricting flow or coil performance.
Measuring CFM and Building Your Baseline
CFM is the linchpin. Nameplate says 1,200 CFM. Don’t trust it. Nameplate assumes ideal conditions: clean filter, zero duct restriction, fan at full speed. Real installations live in the messy world.
A duct traverse measures actual CFM by dividing a duct cross-section into a grid, taking velocity readings at multiple points with a hot wire anemometer, and averaging them.² Math is simple: average velocity (feet per minute) × duct cross-sectional area (square feet) = CFM. A 12-inch by 12-inch duct is 1 square foot. If average velocity reads 600 feet per minute, you have 600 CFM. That’s half the nameplate 1,200.
The first time you measure a system, you’re creating a commissioning baseline: the benchmark for healthy operation. Twelve months later, you run the same traverse and calculate the same formula. If capacity has dropped 10 to 15 percent, the coil is fouling or the filter is loaded.
Research from the Florida Solar Energy Center tracked 46 homes over 4.5 years and found cooling performance degraded at a median rate of 5.2 percent per year, ranging from 3 to 7 percent annually.³ That trend data lets you plan maintenance before the system fails.
The distinction between startup and commissioning becomes clear: startup is the safety checklist. Commissioning is performance optimization. Measured performance data isolates the variables. A low CFM reading points you to the filter, blower wheel, belt tension, or duct leaks, not to blind guessing based on gauges.
When Capacity Falls Short
When a 2-ton system measures at 1.5 tons, the cause is almost always one of three things.
Coil fouling: Dust and biological growth restrict airflow through the evaporator. You’ll see a smaller temperature drop across the coil and latent capacity drops because air doesn’t spend enough time in contact to dry out. Clean the coil and capacity usually recovers 80 to 90 percent.
Blower degradation: A belt-driven blower running slow, a direct-drive blower losing efficiency, or a variable-speed motor set to low speed reduces CFM. Temperature drop might look okay because less airflow lets the coil chill what passes through more effectively. But total capacity tanks because CFM is the multiplier.
Ductwork issues: A partially blocked duct, closed damper, or excessive duct leakage means less air reaches the coil or customer. The CFM traverse catches this immediately. Once you know CFM is low, walk the ductwork for kinks, corrosion holes, or disconnects.
Each is actionable. Each has a fix. Each is visible only if you measure. General troubleshooting guides cover electrical checks and refrigerant analysis, but airside measurement points you at the root cause fast.
Why You Don’t Always Need Gauges
Here’s the heretical claim: if the system measures at rated capacity on the airside, there’s no reason to touch the gauge ports.
Gauges diagnose refrigerant circuit problems: charge, metering device restriction, non-condensable contamination, compressor valve leakage. Those are real issues. But they’re not every issue. If a 2-ton system outputs 24,000 BTU and superheat is within normal range, the refrigerant circuit is doing its job. The coil is absorbing the right amount of heat. The compressor is pumping. The condenser is rejecting heat.
Every gauge connection introduces contamination risk, moisture risk, and the chance of overcharge or undercharge. Field estimates suggest 2 to 5 ounces of refrigerant lost per complete gauge hookup and disconnect cycle with standard hoses. Low-loss fittings reduce this significantly. If airside data says the system is fine, don’t take that risk.
Proctor Engineering’s study of over 13,000 residential units found that 34 percent were undercharged and 28 percent were overcharged. More than 60 percent operated below rated capacity due to refrigerant issues alone.⁴ Add airflow problems on top, and the NCI’s finding that 85 percent of systems deliver less than 60 percent of rated capacity starts making sense.
Starting January 1, 2026, the EPA dropped the refrigerant management threshold from 50 pounds to 15 pounds. Systems containing 15 or more pounds of regulated refrigerant now fall under strict federal leak tracking and 30-day repair requirements.⁵ This is where smart probes and non-invasive tools shine. You get the data. You don’t take the risk. You can tell the customer: “I measured your system. It’s delivering exactly what it’s supposed to.”
The Field Conversation
You walk in, customer says, “I think my air conditioner isn’t cooling as well as it used to.”
Old approach: pull gauges, assume.
New approach: traverse, psychrometric readings, formula.
Tell them exactly how many BTU they’re getting. Low capacity? You have data-backed proof. Normal capacity? You have data-backed proof. Either way, no guessing. That’s commissioning.
Additional Sources
- “Psychrometrics: Theory and Practice”, ASHRAE Handbook of Fundamentals, Chapter 1, 2021.
- “HVAC Quality Installation Specification”, ANSI/ACCA 5 QI-2015.
- “Evaluation of Air Conditioning Performance Degradation”, Caton et al., Florida Solar Energy Center (FSEC), FSEC-PF-474-18, 2018.
- “What Can 13,000 Air Conditioners Tell Us?”, Proctor and Downey, ACEEE Summer Study Proceedings, 2002.
- “Refrigerant Management Requirements under EPA Section 608 and the AIM Act”, EPA 40 CFR Part 82, Subpart F, 2024.
Whether you require installation, repair, or maintenance, our technicians will assist you with top-quality service at any time of the day or night. Take comfort in knowing your indoor air quality is the best it can be with MOE heating & cooling services Ontario's solution for heating, air conditioning, and ventilation that’s cooler than the rest.
Contact us to schedule a visit. Our qualified team of technicians, are always ready to help you and guide you for heating and cooling issues. Weather you want to replace an old furnace or install a brand new air conditioner, we are here to help you. Our main office is at Kitchener but we can service most of Ontario's cities
Source link