Key Takeaways
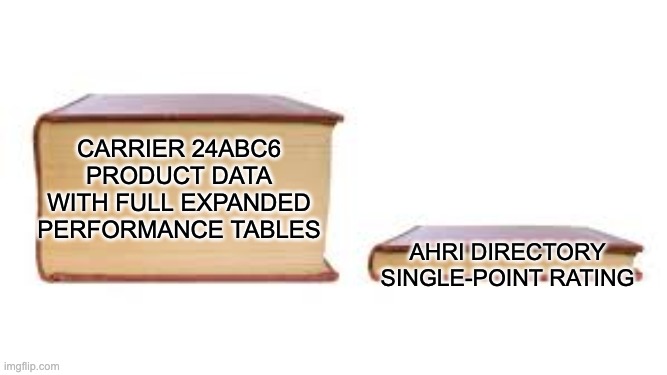
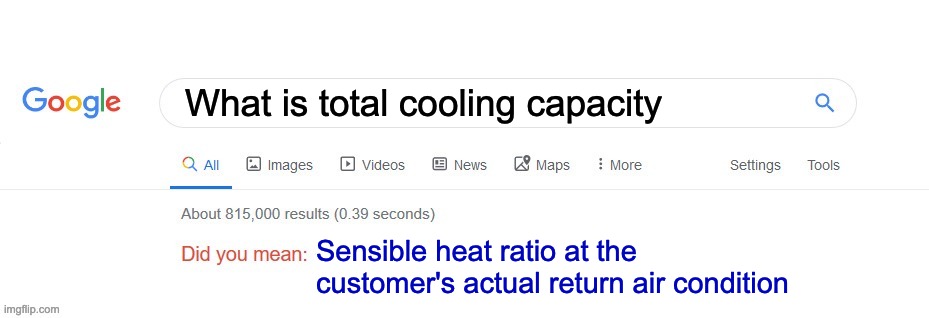
- Total BTU on the data plate tells you almost nothing about dehumidification: The AHRI 210/240 rating point is one row on one chart. Real latent capacity lives in the manufacturer’s expanded performance tables, indexed by indoor wet bulb across the top.
- Wet bulb is the moisture pressure on the coil: Higher indoor wet bulb means more water vapor in the return air, lower sensible heat ratio (SHR), and more latent BTU output. Lower wet bulb means a drier coil and SHR climbing toward 0.90.
- Sensible Heat Ratio is the diagnostic number you have not been pulling: At AHRI rating conditions of 80°F dry bulb and 67°F wet bulb indoor, most residential split systems land between 0.70 and 0.80 SHR. At 63°F wet bulb the same unit climbs above 0.85. That shift explains why customers feel muggy at 74°F.
- Pulling the actual chart on every install changes the conversation: Show a customer the published SHR at the conditions in their house and the humidity complaint becomes an engineering conversation instead of a guessing game.
A tech sells a properly sized 3 ton system, dials in the charge, balances airflow, and clears the punch list. Two months later the customer calls. The house feels muggy at 74°F. The tech assumes leak, mis-charge, or duct issue. Manometer is clean. Charge is right. Coil temps look fine. The customer still feels muggy.
The unit is not broken. The coil’s sensible heat ratio at the wet bulb that house is running is around 0.85. After the thermostat is satisfied, there is almost no latent capacity left. That answer lives on page 14 of an engineering data PDF the tech has never opened.
This is the chart literacy gap. The total BTU number on the data plate is one point on a multi-page table. The customer’s actual operating conditions are somewhere else on that table. Until the tech reads the wet bulb column and sees the actual split, the humidity complaint stays unsolvable.
Where the Wet Bulb Column Actually Lives
Every residential split-system AC and heat pump on the AHRI Directory is rated under AHRI Standard 210/240. The standard mandates a single rating point: 80°F dry bulb and 67°F wet bulb indoor return, 95°F dry bulb outdoor, indoor airflow at the manufacturer’s rated CFM (typically 400 CFM per ton).¹ That single point produces the total capacity number you see on the data plate, in the AHRI Directory listing, and on the marketing brochure.
The expanded performance tables are a different document. Carrier calls theirs Product Data. Trane publishes Product and Submittal Data. Lennox uses Engineering Handbooks. Daikin and Mitsubishi publish Engineering Manuals. Each of these documents includes the indoor expanded performance table with one extra dimension: a column for each indoor wet bulb condition.
The wet bulb columns typically span 57°F up to 75°F, with intermediate columns at the AHRI rating point of 67°F. Down the side of the same table you find outdoor dry bulb ambient, usually 75°F up to 115°F. The cells hold total capacity, sensible capacity, and sometimes the published airflow at that operating point.
Find the expanded performance table for any model you service and the conversation about dehumidification gets technical instead of speculative. Most manufacturers publish these PDFs on their contractor portals under “Engineering Data,” “Product Data,” or “Submittal.” Search by model number, not by marketing campaign.
Click chart to place Point A. Drag points to move.
Why Wet Bulb Tells You About Moisture
Wet bulb temperature is what a thermometer reads with a wet wick around the bulb in a moving airstream. Evaporation cools the wick. The more moisture the surrounding air can still absorb, the lower the wet bulb sits relative to dry bulb. Wet bulb is a direct field-readable indicator of how much water vapor the return air is carrying.
Three anchor points worth memorizing for the chart-reading conversation:
| Indoor Condition | Indoor Wet Bulb |
|---|---|
| 75°F DB / 50% RH (typical dry interior) | ~63°F WB |
| 80°F DB / 51% RH (AHRI rating point) | 67°F WB |
| 78°F DB / 70% RH (muggy southern summer) | ~72°F WB |
The values come straight off ASHRAE Psychrometric Chart No. 1.² At the AHRI 67°F wet bulb rating point the indoor RH is exactly 51.1%. Manufacturers rate to this point because it sits in the middle of the residential operating range and produces predictable lab results.
Higher wet bulb on the indoor side means the coil reaches its apparatus dew point further from the inlet. More coil surface is below dew point. More moisture condenses. Latent capacity goes up. Sensible capacity is mostly unchanged.
Lower wet bulb means the apparatus dew point is harder to hit. The coil runs drier. Latent capacity falls. The same hardware in the same outdoor condition pulls almost no water out of a return airstream at 63°F wet bulb.
Reading the Chart Row by Row
The mechanics are not complicated once you see them on a real PDF. Pull an expanded performance table for a 3 ton, 14 SEER2 residential split system at the manufacturer’s rated CFM (1,200 CFM, which is 400 CFM per ton). Find the row for 95°F outdoor ambient. Now walk across the wet bulb columns.
At the AHRI rating point (95°F outdoor / 67°F WB indoor / 400 CFM per ton), typical residential 3 ton equipment publishes:
| Wet Bulb | Total MBh | Sensible MBh | Latent MBh | SHR |
|---|---|---|---|---|
| 71°F | ~36.0 | ~25.0 | ~11.0 | ~0.69 |
| 67°F (AHRI) | ~35.2 | ~27.0 | ~8.2 | ~0.77 |
| 63°F | ~34.5 | ~30.0 | ~4.5 | ~0.87 |
| 57°F | ~34.0 | ~32.5 | ~1.5 | ~0.96 |
Numbers are representative of a published Carrier 24ABC6 or similar 3 ton 14 SEER2 unit at the noted conditions.³ Pull the actual model’s data for any specific job.
Read across the table and the story emerges. Total capacity barely moves. Sensible capacity climbs as the indoor air gets drier. Latent capacity collapses. The unit is the same. The airflow is the same. The outdoor condition is the same. Only the indoor wet bulb has changed, and the latent capacity went from 11 MBh down to 1.5 MBh.
Convert latent MBh to pints per hour using the latent heat of vaporization. At 70°F, water carries about 1,054 BTU per pound, or roughly 1,096 BTU per pint at standard water density.⁴ A 3 ton unit at 67°F wet bulb pulling 8.2 MBh latent removes roughly 7.5 pints per hour from the airstream. At 63°F wet bulb the same unit pulls 4.5 MBh latent, or about 4.1 pints per hour. At 57°F wet bulb the unit is essentially a fan with a thermostat.
That collapse is the answer to half the residential humidity complaints in the field. The system is sized correctly for the sensible load. The latent load was never the AC’s job once the customer’s indoor conditions drifted into the lower wet bulb columns.
Sensible Heat Ratio in Plain Field Terms
SHR is just sensible BTU divided by total BTU. A number between 0.65 and 0.96 for residential AC across realistic conditions.⁵ Low SHR means more dehumidification work per BTU of cooling. High SHR means more temperature drop and almost no moisture removal.
Quick reference for the truck:
- SHR 0.95: ~5% latent. Dry interior or oversized system, almost no dehum.
- SHR 0.85: ~15% latent. Northern shoulder season, properly conditioned space.
- SHR 0.77: ~23% latent. AHRI rating point, the published comparison number.
- SHR 0.70: ~30% latent. Southern summer peak humidity day.
- SHR 0.65: ~35% latent. Inverter at minimum capacity in a humid climate.
SHR shifts with airflow. The standard residential setpoint of 400 CFM per ton produces the published rating point. Drop the indoor blower to roughly 350 CFM per ton and SHR falls by approximately 0.04 to 0.06, depending on the model and the operating point.⁶ Per ACCA guidance and Manual S equipment selection, the lower-CFM approach is appropriate for humid climates where latent capacity matters more than the sensible setpoint.⁷ Verify against the model’s expanded performance data before committing to a non-standard tap.
The companion airside check is the airside performance verification approach, which covers measuring real BTU output without gauging up on every call. Use that workflow to confirm the actual CFM the system delivers, then compare against the expanded performance table to read the SHR at the actual operating point.
Why This Changes the Diagnostic Conversation
Customer at 74°F dry bulb, 60% RH indoor, AC running fine, complaint is “muggy.” A psychrometric calculator (or the chart) puts the indoor wet bulb near 65°F.
Pull the unit’s expanded performance data at 65°F wet bulb and the actual outdoor design temperature. Read sensible and latent capacity off the table. Compare latent capacity in MBh to the moisture load on the structure, calculated using the dehumidifier sizing workflow covered in the companion piece on this topic. Use ACCA Manual J for the actual building math.
Three outcomes are possible:
- Latent capacity at actual conditions covers the load. The AC handles humidity in this specific home. Re-check airflow, look for hidden infiltration, and verify the static pressure budget before assuming anything is wrong with the equipment.
- Latent capacity is close to the load but trending short. Lower the indoor blower toward 350 CFM per ton if the static budget allows. Verify the new SHR off the expanded performance data. If you cannot get there, the customer needs a dedicated dehumidifier as stage one of cooling.
- Latent capacity is far short of the load. The AC was sized correctly for sensible. The latent shortfall is structural to the equipment selection. A whole-home dehumidifier or a downsize to a variable-capacity inverter system is the answer, not a recharge.
This is the conversation that earns customer trust. You are not blaming the equipment. You are explaining the engineering. The chart does the talking.
What Inverter and Two-Stage Systems Change
Variable-capacity inverter systems modulate compressor speed across a wide range, often 25 to 100 percent of nominal capacity. At minimum capacity the system runs nearly continuously during mild humid weather. The evaporator coil holds at a lower temperature for longer. Coil contact time goes up. SHR drops.
Field-typical inverter behavior at minimum capacity in a humid climate: SHR in the 0.65 to 0.70 range, sometimes lower, depending on indoor wet bulb and airflow. Published Trane XV20i and Carrier Infinity series expanded performance data confirms the trend, though exact values vary by model. Pull the actual data for the unit you commissioned.
Two-stage scroll compressors deliver a more modest but still meaningful improvement. Low-stage operation typically runs around 65% of nominal capacity. Field experience suggests low-stage SHR is roughly 0.04 to 0.08 lower than high-stage SHR at the same indoor wet bulb, assuming the indoor blower scales down proportionally. If the ECM blower stays at high-stage CFM during low-stage compressor operation, the SHR can actually rise because the coil never gets cold enough.
Mini splits and multi-zone heat pumps are a different chart-reading exercise entirely. The minimum-capacity floor on a multi-zone outdoor unit often exceeds the actual load on a single small zone, which forces short cycles and pushes SHR toward 1.0 instead of down. The full picture lives in the mini split dehumidification problem nobody warned you about.
This is where the “do I need a dedicated dehumidifier” question gets a defensible answer. Pull the expanded performance data for the unit at low stage (or minimum capacity, for inverter systems). Compare latent capacity at the customer’s typical indoor return wet bulb to the moisture load on the structure. If the equipment can cover the load at low stage with margin, the dedicated dehumidifier is optional. If it cannot, treat the dehumidifier as stage one of cooling.
The decision belongs to the chart, not the marketing brochure. For background on the capacity modulation hardware, see the variable speed scroll compressor primer and the two-stage scroll compressor primer.
Five Minutes to the Right Chart
A field workflow that works on most calls:
- Note the model and serial off the indoor air handler or condenser data plate.
- Go to the manufacturer contractor portal (Carrier HVAC Partners, Trane Connect, Lennox Pros, etc.) and search by model.
- Open the document labeled “Product Data,” “Engineering Data,” “Submittal,” or “Performance Tables.”
- Navigate to the section titled “Cooling Capacity,” “Detailed Cooling Capacity Tables,” or “Indoor Coil Performance.”
- Locate the wet bulb columns across the top and the outdoor dry bulb rows down the side.
- Cross-reference the customer’s actual outdoor design dry bulb against the wet bulb that matches their indoor return condition.
- Read total, sensible, and latent capacity at that intersection. Calculate SHR.
The whole lookup is 60 seconds once you have done it on three or four model lines you service regularly.
Some software tools (eg measureQuick) can automate much of this workflow, supporting AHRI model number lookup to pull rated capacity data and combining that with live field measurements from connected probes to calculate real-time SHR.⁸
But you can do it without an app – a screenshot of the relevant table on your phone takes the lookup to 30 seconds. Build the screenshots for the model lines you install and service most often. The library pays for itself the first time it stops a recharge that did not need to happen.
Bringing It Back to the Truck
Total BTU is one number on a brochure. Sensible Heat Ratio at the customer’s actual operating conditions is the diagnostic answer to half the humidity complaints in residential HVAC. Both numbers come from the same engineering data PDF. One of them is on the data plate. The other is on page 14.
Pull the expanded performance data before your next humidity complaint call. Identify the wet bulb at the customer’s actual indoor return. Read the SHR off the table. Bring the chart to the conversation. The complaint stops being a guessing game and becomes a sizing or commissioning decision with a verifiable answer.
The AC is the sensible side. The dehumidifier, if needed, is the latent side. The chart tells you which one is failing the customer in front of you.
Additional Sources
- “AHRI Standard 210/240-2023: Performance Rating of Unitary Air-Conditioning and Air-Source Heat Pump Equipment”, Air-Conditioning, Heating, and Refrigeration Institute, 2023.
- “ASHRAE Psychrometric Chart No. 1 (Normal Temperature, I-P Units)”, American Society of Heating, Refrigerating and Air-Conditioning Engineers, 2021.
- “Product Data: 24ABC6 Comfort 16 Air Conditioner”, Carrier Corporation, 2021.
- “ASHRAE Handbook of Fundamentals, Chapter 1: Psychrometrics”, American Society of Heating, Refrigerating and Air-Conditioning Engineers, 2021.
- “ASHRAE Handbook of HVAC Systems and Equipment, Chapter 18: Air-Cooling Coils”, American Society of Heating, Refrigerating and Air-Conditioning Engineers, 2024.
- “Carrier Product Data, 24ABC6 Comfort 16 Air Conditioner: Expanded Cooling Performance Tables”, Carrier Corporation, 2021.
- “ANSI/ACCA 3 Manual S, Residential Equipment Selection, Third Edition”, Air Conditioning Contractors of America, 2023.
Whether you require installation, repair, or maintenance, our technicians will assist you with top-quality service at any time of the day or night. Take comfort in knowing your indoor air quality is the best it can be with MOE heating & cooling services Ontario's solution for heating, air conditioning, and ventilation that’s cooler than the rest.
Contact us to schedule a visit. Our qualified team of technicians, are always ready to help you and guide you for heating and cooling issues. Weather you want to replace an old furnace or install a brand new air conditioner, we are here to help you. Our main office is at Kitchener but we can service most of Ontario's cities
Source link