Key Takeaways
- Detection shows you something is wrong, diagnosis shows you why it matters. Most HVAC systems stop at threshold-based alerts, but real insight comes from correlating multiple signals over time to understand root cause and business impact.
- Context transforms noise into intelligence. The same temperature reading can be healthy or problematic depending on outdoor conditions, equipment state, valve positions, and operational mode. Threshold logic cannot interpret context.
- Organize alerts by business priority, not just technical alarm. Mission-critical comfort and uptime alerts should rise to the top, followed by efficiency concerns, then optimization opportunities. This hierarchy prevents alert fatigue and focuses teams on what truly drives building performance.
- Pattern-based diagnostics require multiple signals, time trends, and physics validation. Building rules around how equipment actually behaves in the real world, rather than single-point thresholds, dramatically reduces false positives and reveals actionable root causes.
The Difference Between Detection and Diagnosis
Detection is binary. A threshold was crossed. A valve position doesn’t match a command. The alarm fires.
Diagnosis is nuanced. It answers the hard questions: Why is this happening? What system interactions are at play? How does this affect comfort, efficiency, and reliability? What action should be taken?
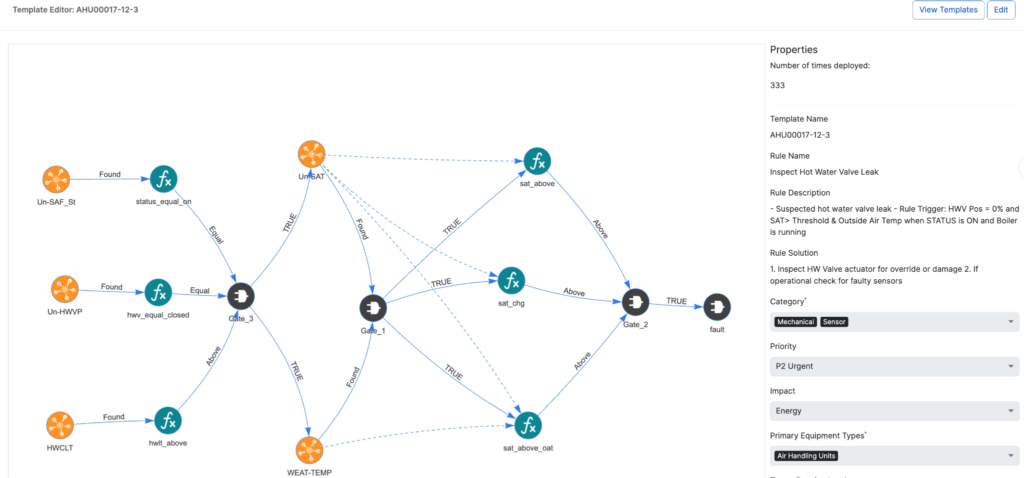
Most systems stop at detection. They throw an alert when a temperature crosses a threshold or a valve doesn’t respond. That’s incomplete. Buildings rarely operate in isolation. A hot water valve leak isn’t just about the valve. It’s about the relationship between heating calls, supply temperature, valve position, outdoor air conditions, zone conditions, supply air fan status, and system schedule.
Think of it like a visit to the doctor. Detecting a high fever is the first step. A good diagnosis requires asking why: Is it an infection? Inflammation? Environmental stress? The symptom is clear in both cases. The cause is not.
That gap between symptom and cause is where the opportunity lies. It’s the difference between reactive alert fatigue and proactive system intelligence.¹
Why Threshold-Based Fault Detection Falls Short
Understanding BMS control fundamentals is essential here, because the gap between detection and diagnosis lives in the control logic itself.
Most fault detection logic relies on simple thresholds: if temperature > X, alert. If command ≠ feedback, alert. This approach catches obvious, acute failures like a compressor that won’t start or a sensor that stops reporting. But threshold logic breaks down when systems interact or operating context changes, which is almost always in commercial HVAC.
Consider a discharge air temperature above setpoint. In isolation, this triggers an alarm. But context matters. If the boiler is running, outdoor air is 15°F, the heating valve is commanded open, and discharge air sits at 125°F instead of the 110°F setpoint, this might indicate a stuck heating valve or miscalibrated sensor. If it’s 75°F outside, the boiler is off, the heating valve is commanded closed, and the air handler is in economizer mode pulling outdoor air directly with discharge air at 78°F, this is normal operation. The same temperature reading means completely different things in different contexts. Thresholds can’t interpret context. They can only react blindly, which is why facility teams turn off alerts. The alarms lack correlation and intelligence. They don’t tell a story.²
A Framework for Moving Beyond Simple Detection
A proper diagnostic rule incorporates all relevant data points across the equipment and its operation, incorporates trends over time rather than snapshots, validates logic against physics, and prioritizes by impact and risk. Context matters. A heating valve leak on a 95°F day has almost zero impact on comfort. The same leak on a 20°F morning is mission critical. A chilled water pump cavitation event during occupied hours is an emergency. The same event during night setback might self-resolve without intervention.
Your rules should account for time of occupancy, weather conditions, equipment redundancy, and financial impact. This means alert priority can be dynamic. The same technical fault might generate a critical alert at 2 p.m. on a summer day and a low-priority alert at 2 a.m. in November.
From Data Overload to Data Insight
Technicians, engineers, and operators are drowning in data from BMS Basics guide, smart IoT sensors, cloud dashboards, and mobile apps. But data alone doesn’t create insight.
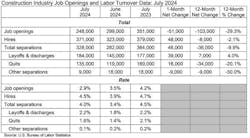
Research by Granderson et al. (2023) found that 40% of air handling units and 30% of air terminal units showed a reported fault on any given day. The average building generated 245 fault reports per month.² When every alert screams urgent, nothing really is. The key is structuring alerts around what truly matters: comfort and uptime, efficiency, and optimization.
Think of it as a pyramid. At the base, everything is data. At the top, only signal remains.
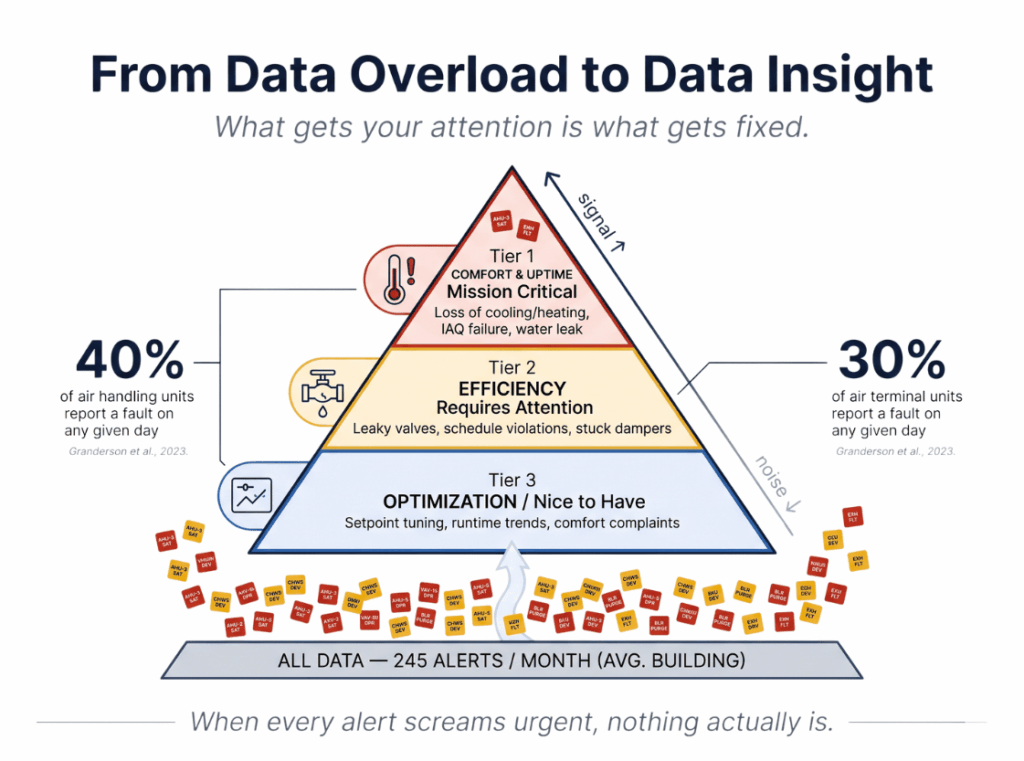
Tier 1: Comfort and Uptime (Mission Critical). Loss of cooling or heating to a space during occupied hours, airflow blocks, poor indoor air quality, and water leaks. These trigger immediately and escalate to facilities or service. The building might be uncomfortable within 30 minutes if left unaddressed.
Tier 2: Efficiency (Requires Attention). Leaking control valves, poor schedules or setpoint compliance, excessive equipment runtime despite stable conditions, economizer dampers stuck partially open, and sequence of operations violations. Over a heating season, a 10% leaky valve costs thousands in wasted fuel. These need attention but not emergency response.
Tier 3: Optimization (Predictive and Strategic). Recurring issues on specific units, predictive maintenance triggers, demand trends, and operational improvements. These inform the maintenance calendar, capital planning, and operational improvement projects. They are the highest-leverage work because they prevent problems from becoming emergencies.
NREL estimates 5 to 15% of commercial building energy is wasted due to HVAC faults. The DOE puts the total impact at 0.7 quads annually, worth roughly 14 billion dollars.⁴ The upper-end 30% figure from the EPA refers to building-wide energy waste across all systems, not HVAC alone.
Common Implementation Pitfalls
Most FDD systems fail not because the concept is flawed, but because implementation falls short. Poor point naming and metadata (a BMS User Interfaces audit can catch this), false positives that overwhelm the team, lack of ongoing maintenance on rules themselves, ignoring the human side of alert interpretation, and treating all faults as equal.
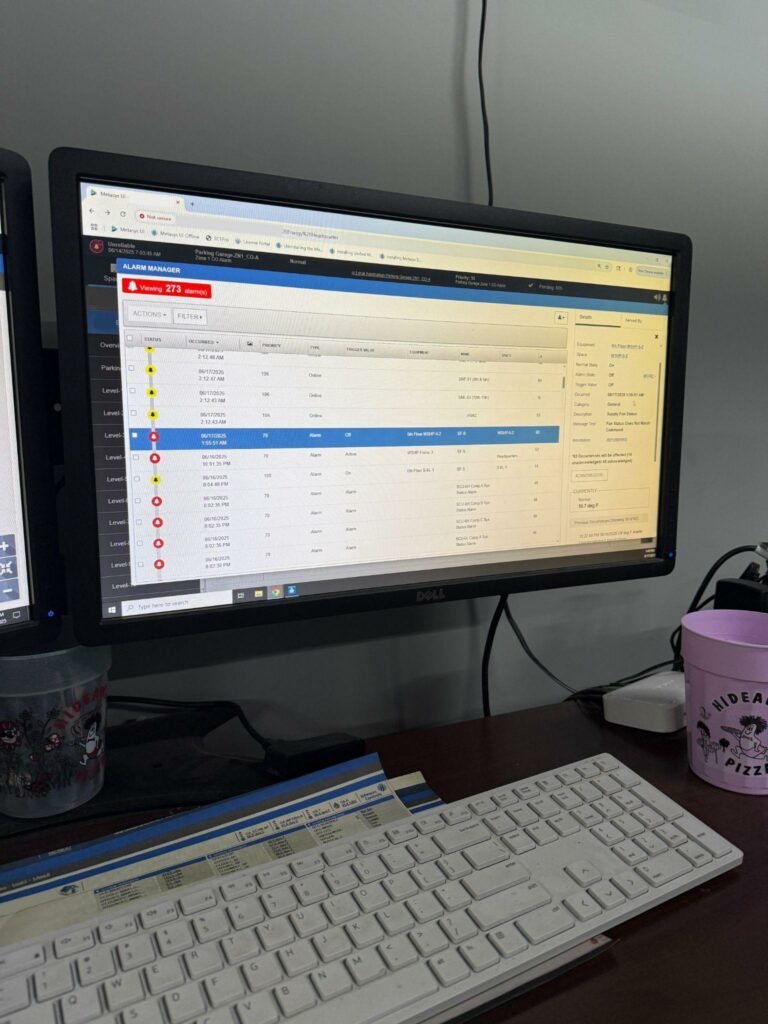
In multi-building deployments, BMS network architecture complexity compounds the naming problem. A study at UC San Diego documented over 10,000 BMS alarms per day, resulting in operator alert fatigue where most alarms were ignored.¹
Rules need to be tuned to your building and system. Expect to spend 2-4 weeks tuning a new rule set in any given building. Even perfect diagnostics fail if the alert message is technical jargon with no context. Good diagnostics include a plain-language description of the problem, likely cause, and recommended action. Without tiering, alert fatigue sets in and critical alarms get ignored.
Pattern Recognition in Practice
Let’s trace through what pattern-based diagnostics looks like. A VAV box in an office building is overcooling during late afternoon. A threshold-based system might alert: “Zone 4B: Temperature below setpoint.” Not very helpful.
A diagnostic approach gathers context (3 p.m., sunny Thursday, fully occupied, zone on southwest corner with high solar load), checks equipment state (VAV damper at 35% open, chilled water supply 42°F, zone temperature 68°F with setpoint 70°F), validates against physics (southwest corner in afternoon sun should have high solar gain, VAV damping is correct, chilled water is normal, so why overcooled?), and digs deeper. Inspect sensor location for direct solar radiation. Check adjacent zones. Verify airflow at 35% damper position. Check zone internal load.
Form a hypothesis: If only Zone 4B is affected, the problem is local. If the sensor is in direct sun, it is reading high and the damper is closing unnecessarily. If the sensor is properly located but airflow is low, there is a blockage. Based on the data, the rule recommends: “Zone 4B is below setpoint.
Likely causes: temperature sensor in direct solar radiation, VAV supply ductwork blockage, zone load lower than scheduled occupancy.
Recommend: inspect sensor location and shade if necessary. Check VAV supply duct for blockage. Verify occupancy schedule.”
This uses multiple data points, applies physics knowledge, contextualizes the problem, and offers actionable guidance. A technician reading this alert understands what is likely wrong and what to check first.
Beyond Alerts to Actionable Intelligence
The end goal is not a system that yells louder or more frequently. It is a system that tells better stories.
The strongest case for moving beyond threshold monitoring comes from the LBNL Smart Energy Analytics Campaign, which tracked 104 organizations across 6,500 buildings and over 500 million square feet. Threshold-based energy information systems delivered median annual savings of 3%. Analytics-based fault detection and diagnostics delivered 9%. That is a 3x multiplier for moving from simple threshold monitoring to pattern-based diagnostics, with a payback period of 1 to 2 years.³
The same logic applies to non-invasive system testing on the residential side: correlate multiple airside measurements before reaching for quick conclusions. This mirrors the structured approach in a general HVAC troubleshooting guide: isolate variables, test hypotheses, converge on root cause. Correlation and pattern recognition eliminate false positives and help onsite teams work smarter and faster.
The thought process behind diagnosing a high supply air temperature is not just pattern-matching. It is logic: is the boiler running? What are the hot water supply and return temperatures? What is the heating valve commanded position? Is the valve feedback matching the command? What is the outside air temperature? What is the airflow? Is the system operating to schedule? Has the unit been stable for a while?
Building Systems for Better Diagnosis
If you are evaluating or implementing a diagnostic system, look for these characteristics: flexibility in rule building (no-code is ideal for iterative tuning), access to historical data (so rules can learn seasonal patterns), ability to correlate across equipment, clear alert prioritization, actionable output (not just “something is wrong,” but “here is what to check”), and team collaboration tools for feedback and refinement.
CIM and the Future of Building Analytics
CIM’s PEAK Platform is an AI-powered building analytics platform that uses automated FDD to maximize commercial building performance through no-code alert template builders that make diagnostic logic accessible to everyone.
California’s 2025 Title 24 energy code now requires ASHRAE Guideline 36 programming in all new or replacement commercial HVAC systems starting January 1, 2026.⁵ For organizations building diagnostic systems around semantic tagging or data standardization, ASHRAE Standard 223P, the Semantic Data Model for Analytics and Automation Applications in Buildings, entered its first public review in mid-2025 and is expected to be finalized by 2027. Developed in collaboration with Project Haystack and Brick Schema, 223P will enable FDD algorithms to be portable across buildings by standardizing how data points are semantically labeled.
Additional Sources
- “Data Driven Investigation of Faults in HVAC Systems with Model, Cluster and Compare”, Narayanaswamy et al., Carnegie Mellon / Synergy Labs, BuildSys 2014.
- “Empirical Analysis of the Prevalence of HVAC Faults in Commercial Buildings”, Granderson et al., Science and Technology for the Built Environment, 2023.
- “Proving the Business Case for Building Analytics”, Lawrence Berkeley National Laboratory (LBNL), Smart Energy Analytics Campaign, 2019.
- “The Energy Impact of Faults in U.S. Commercial Buildings”, Roth et al., TIAX LLC, Purdue International Refrigeration and Air Conditioning Conference, 2004.
- “High-Performance Sequences of Operation for HVAC Systems”, ASHRAE Guideline 36-2021.
Whether you require installation, repair, or maintenance, our technicians will assist you with top-quality service at any time of the day or night. Take comfort in knowing your indoor air quality is the best it can be with MOE heating & cooling services Ontario's solution for heating, air conditioning, and ventilation that’s cooler than the rest.
Contact us to schedule a visit. Our qualified team of technicians, are always ready to help you and guide you for heating and cooling issues. Weather you want to replace an old furnace or install a brand new air conditioner, we are here to help you. Our main office is at Kitchener but we can service most of Ontario's cities
Source link